The CDC has downgraded its estimate for the effectiveness of this year’s influenza vaccine to 19%. Historically, this is not great, and it is widely being reported as a failure. Further, US influenza vaccine coverage rates are a disappointing 40% meaning that only about 4 in 10 people actually get vaccinated. Too many people are taking the view, “Even if I get the flu vaccine, there is still an 80% chance I will get the flu so why should I bother?” Is the situation really so bleak? Actually, this year’s “lousy” flu vaccine was a huge success and it almost certainly saved thousands of lives. To see why, read on.
Despite common perceptions, influenza is not all that contagious. The reproductive ratio (R0) is about 1.75 for influenza. In other words, each case of influenza infects 1 or 2 or maybe three new people. Compare that to a highly contagious disease like measles where each case typically infects 19 more individuals. Influenza does have a short generation time; a new case becomes infectious only about 3.6 days after exposure. Fortunately, the flu season is relatively short, may 1 to 2 months, but in that time, influenza may go through 15 generations. One infected person infects on average 1.75 new people who in turn infect about 3 people who in turn infect about 5, and so on.
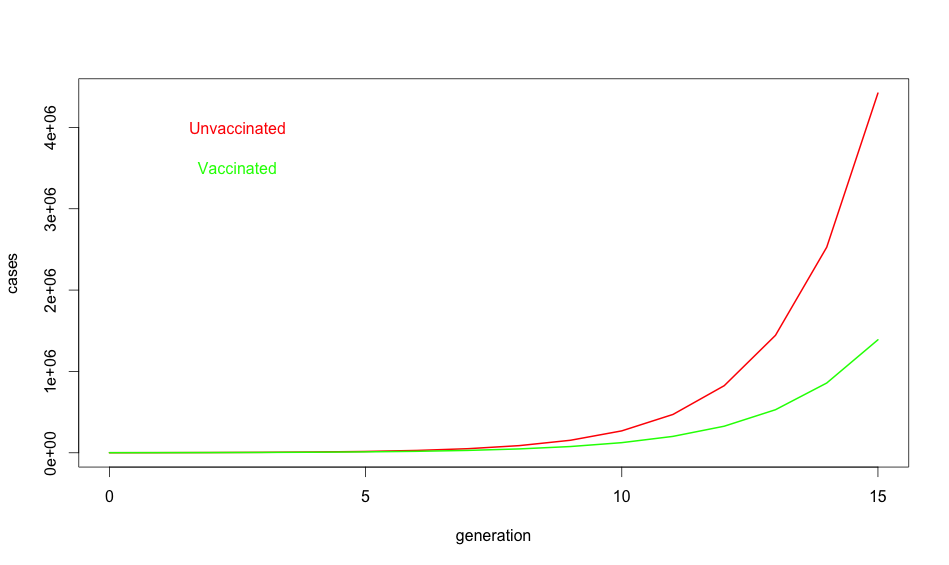
So what about at this year’s vaccine? R0 is defined on people who never got the vaccine. When we say the vaccine is 19% effective, we are saying if everyone got vaccinated it would reduce R0 by 19% [1] or to about 1.42. Unfortunately, only about 40% of Americans did get the vaccine, so on average R0 was maybe 1.62. Does not seem like a big deal, 1.75 vs 1.62, but look at what happens with exponential growth. With the “lousy” vaccine, one infected person infects about 1.62 new people who in turn infect about 2.6 who in turn infect about 4.2. It is like your financial advisor keeps saying, the miracle of compound growth. Every generation, the difference between unvaccinated populations and vaccinated populations gets bigger and bigger. And for flu, there are many generations. After fifteen generations in an unvaccinated population, a single case of influenza will spread to about 10 million people if R0 is 1.75. But if R0 is reduced just a bit to 1.62, it will spread to about 3.6 million people. In other words, even this year’s “lousy” vaccine taken by only about 40% of the population still ended up reducing the total number of flu cases by 60%.
A 60% reduction in influenza cases is a big deal. About 3,600 people die from influenza, even with vaccination. If we did not have the vaccine, as many as 10,000 deaths would be expected. So yes, when I say this year’s flu vaccine was a success, I mean YES, it was a big success that saved thousands of lives. Don’t believe all the nay saying in the press, and get vaccinated. It really does save lives.
Footnotes:
[1] A note about models and effectiveness. For the purpose of this simple model, vaccine effectiveness is defined as the probability that a vaccinated individual will resist infection when they are exposed to the virus. For a variety of practical and ethical reasons, we cannot do an experiment to measure vaccine effectiveness directly by, for example, conducting a randomized controlled trial. When the CDC reports vaccine effectiveness, they rely on observational studies. In the case of flu vaccine, the approach is to take all of the people coming to a medical facilities and ask two questions: 1) Do they actually have influenza or is their URI due to some other agent? 2) Did they get the flu vaccine this year? To determine vaccine effectiveness, you compare the fraction of vaccinated people who really have influenza to the fraction of unvaccinated patients who have influenza. If the vaccine did nothing, the ratio would be the same and we would say the effectiveness is zero. If the vaccine were completely effective, none of the vaccinated people would test positive for influenza and we would say the vaccine was 100% effective. And if the fraction of vaccinated people who got the flu is lower, say 0.8 fold less than the fraction of unvaccinated people who really got the flu, we would say the vaccine was 20% effective.
There are some caveats to taking the effectiveness from observational studies and using them in a mathematical model for an epidemic. The very simple model used above assumes people are independent and contacts between people and occur randomly with uniform probability. We know this is a simplistic a view of real societies. For example, people tend to live in groups (families, roommates, etc.), and vaccination is likely to be strongly correlated within a group (if you got vaccinated, chances are high that your spouse and kids did as well). Also, because people living in a group tend to spend a lot of time together, if one person in the group gets infected with the flu, there is a much higher than average likelihood that they will expose everyone in the group to the virus. On the other hand, if everyone in the group was vaccinated, the group will be doubly protected, first because each member in the group is less likely to come down with the flu in the first place, and second because even if one person in the group does come down with the flu, they are less likely to pass it on to the whole group. This means that the observationally measured effectiveness may be somewhat higher than the mathematical effectiveness. Define susceptibility as 1-effectiveness. In the most extreme case, the observationally measured susceptibility might be the square of the mathematical susceptibility so an observational 81% susceptibility (19% effectiveness) might correspond to a mathematical susceptibility of 0.9 and a mathematical vaccine effectiveness as low as 10%. Note, however, that even in this worst case, vaccination reduces the number of case by more than 40% after 15 generations.
For the non-scientists who have made it this far, these calculations are what we call “back of the envelope” estimates. The intent is to give a feel for what is going on, but not to achieve rigorous accuracy. Far more sophisticated models for influenza epidemics have been developed by scientists who have devoted their careers to epidemic modeling. See, for example, a study on the effects of commuting on influenza spread.
One thought on “This Year’s “Lousy” Flu Vaccines Was Actually a Huge Success and Likely Saved Thousands of Lives”