All posts by David States

Chief Medical Officer Biovest International, Inc. The views expressed here are strictly my own and do not represent my employer.

Why does CMS persist in overpaying for durable medical equipment?

Durable medical equipment (DME) has been fertile ground for fraud for decades because Medicare pays far above the market price. In two recent examples, DME supply companies were convicted of fraudulently billing $3.3M and $3.5M. Fraud is so attractive because companies are buying wheelchairs for $900 and selling them to Medicare for $6000. In another case, the Dept of Health and Human Services Office of the Inspector General called out Medicare for overpayment of $251 million dollars for portable infusion devices because they have not updated their market price list since 2003. This kind of systematic over payment has been going on for many years.
Having a large discrepancy between the amount Medicare will reimburse for equipment compared to the market price for obtaining that equipment creates a big incentive for fraud. Every piece of equipment sold scores a big profit. Not surprisingly, DME has been a fertile area of Medicare fraud for decades. If the prices Medicare paid reflected  true market prices there would not be such an incentive for fraud. Prices that better reflected market pricing would also mean that DME items could be made available to more patients who would actually benefit from them.
To combat DME fraud, the Center for Medicare and Medicaid Services (CMS) has enacted detailed documentation requirements that physicians must complete before a patient can receive DME items. Certificates of Medical Necessity must be completed and often additional patient visits must be scheduled for the sole purpose of documenting specific items on the physical exam. As a result, DME fraud prevention has become a substantial administrative burden on primary care physicians, and completing CME paperwork is one the least favorite activities of any primary care provider. Believe me, been there done that. All this time spent completing fraud prevent paperwork is a significant drain on primary care provider time, moral and productivity. There are numerous studies saying that we have and face an increasing shortage of primary care physicians. Dealing with fraud prevention paperwork is one of the things that makes primary care an unattractive career choice for physicians. A better solution would be to pay for DME at market prices eliminating most of the incentive for fraud and relieving physicians of much of the fraud prevent paperwork burden.
While Medicare can be criticized for overuse of services, Medicare is very efficient at procuring healthcare services and pays lower costs than most private insurers. It seems like CMS should be well-positioned to negotiate favorable pricing from DME suppliers, but this never seems to happen.  Why? In 2003, Congress mandated that CMS develop a system for market based pricing of DME equipment, but thirteen years later, the system that they devised does not seem to be working very well.
DME is a $30 billion plus market here, and Medicare is paying a substantial fraction of that. Medicare pricing also sets the market for private insurers. As Everett Dirksen once said “A billion hear a billion there, pretty soon we’re starting to talk about real money.”

How journalists dupe the public with scary sounding headlines when there are many other and reasonable explanations

Recently, a feature appeared with  the title ‘How researchers dupe the public with a sneaky practice called “outcome switching”‘ accompanied by a truly scary graphic shown below. The article went on to claim only 9 of 62 clinical trials analyzed had faithfully reported the outcome of the trial.

Vox.com graphic shared under fair use for comment

Yes, there have been abuses, but before we all run out and say 53 out of 62 clinical trials are trying to mislead us, let’s slow down and think about things. Every clinical trial must specify a primary outcome. The FDA very rarely allows a trial to change the primary outcome, and in the few instances when this does occur, it is only after extensive and critical review. If the primary outcome does not achieve statistical significance, the FDA will reject the trial. Period, end of the game.

Trials also include secondary outcomes. Maybe the primary outcome was improvement in overall survival. Secondary outcomes might be improvement in time to disease progression, improvement in time to next treatment, improvement in patient life style, is the treatment more effective in one subset of patients or another, etc. Often these secondary outcome measures are somewhat redundant, and may not all be included in a publication. Or maybe they just did not achieve P<0.05 statistical significance even though the trend in the data supports the hypothesis. Lots of reasons a publication may not present every last one of the secondary analyses listed in the original protocol.

More importantly, it typically is years, often many years, between the time a clinical trial protocol is approved and the time when the trial is complete and the results are ready for publication. During that time a lot can happen. Science advances, new technologies and new drugs come on the scene. The investigators may notice patterns in the data that they did not anticipate when the protocol was submitted. Should they ignore all of this and limit the publication strictly to the outcomes listed in the original protocol? No, that would slow science and be a disservice to the participants of the trial. Are there multiple hypothesis testing issues associated with looking for interesting patterns in data, absolutely. The issue is not were analyses not listed on the original protocol included in a publication but rather how these new analyses are presented.

Bottom line, clinical research is hard, takes a long time and is very expensive. We need to get the most out of every study which means looking at the data in as many ways as possible and being critical in our thinking when we do.

Of Gilead and the Insurers

Gilead Sciences is in a dispute with insurers about reimbursement for its hepatitis C drugs, solvaldi and harvoni. Complex issue, but fundamentally it is a dispute bewteen some large corporations about very large sums of money, and it is playing out using the lives of individual patients as pawns. That is upsetting.

How did we get here? Health insurance is required to cover medical procedures that are “standard of care”, and the Affordable Care Act requires health insurance policies to provide prescription drug coverage. When people shop for insurance, the prescription co-pay is often an important consideration. But too may insurance policies have started defining different tiers of drugs and playing games with the fine print. Tier 1 may be standard low cost generics. When the insurance company advertises “$5 co-pay on prescriptions” these are the prescriptions that they are talking about. But recently introduced “exotic” drugs are put in Tier 4, “specialty drugs” and for these the co-pay may be 50%. This creates a conflict. The insurance is supposed to cover standard of care, but if standard of care involves a very expensive drug the insurance is suddenly sticking the patient with half the cost, a cost that may be unaffordable for many patients.

Drug companies have responded to this situation by creating drug assistance programs. These are foundations that will help patients for whom co-payments would create a real financial hardship by covering the cost of these co-payments so that the patient can get the medication. Some insurance companies have cut back coverage forcing more patients to apply to these assistance programs. The current dispute is a result of Gilead scaling back its drug assistance program because Gilead feels that the insurance companies have been abusing the program.

Is not the real problem that Gilead is just charging way too much for the drug? Value based pricing says no. Sovaldi and havorni are remarkable drugs. They are very effective, they cure an illness affecting 3% of the world’s population, and they do so quickly and with few side effects. Untreated, 75 to 85% of HCV patients progress to chronic HCV infection, and about 10% of these patients develop advanced cirrhosis. Prior to sovaldi and harvoni, care for hepatitis C infections was costing $7B per year and roughly 15,000 people a year were dying from the disease. Economists estimate that the value of a qality adjusted life year (QALY) is $50,000. If a cancer drug extends overall survival from an average of 12 months to an average of 13 months, it is adding an average of 0.083 QALY and value based pricing would set the fair price at $4,167. Sovaldi and havorni give HCV patients on average several years of good quality additional life. Value based pricing says that $84k for a course of treatment is a real bargain. The fact that these drugs will save the healthcare system an additonal $7B a year that would otherwise have been spent caring for HCV patients is just dressing on the cake.

Good products create demand. Before the iPhone, no one spent much money on smartphones. The iPhone is a good product, and when it hit the market, people started spending a lot of money on smartphones. Sovaldi and harvoni are safe and effective treatments for a bad disease. They are very good products. It is not surprising that there is a great deal of demand for these treatments. 140,000 people were treated with sovaldi in 2014 producing about $11B in revenue for Gilead. 

Is it a bad thing that Gilead is making so much money? Let’s put this into perspective. 15,000 Americans die as a result of HCV infection every year. That is about 1 death every 35 minutes. In the time it took me to write this post, several people died of HCV. It costs a lot of money to bring a drug to market. Maybe not the $1B estimated by the Tufts group, but still, a lot of money. Patents and intellectual property laws reward investors in a successful drug handsomely, and there is no question that this makes it easier to raise funds for future drug development. If it had taken Gilead 6 more months to raise the money needed to bring these drugs to market, that would have cost 7,500 lives.

What do I think should be done? Insurance companies need to stop playing games with drug tiers. If an insurer advertises that the co-pay for a prescription drug is $5 and the drug is standard of care, the patient should only have to make a co-payment of $5. Sovaldi and havorni are standard of care for HCV, they are fairly priced based on the value that they provide and patients should not have to pay exorbitant co-pays to get them. Frankly, the insurers should be grateful to Gilead because the company has developed drugs that improve the lives of their patients enhancing the value of the health insurance that they sell, and these drugs will save the insurers billions of dollars in future expenses.

Vaccines, Publications and Retractions

While not definitive, PubMed is a highly reliable index of the biomedical literature.  If you are interested in finding out about the current status of the vaccine literature, here are some helpful searches:

Clinical trials of vaccines (all) (11,070 publications as of 4/22/2015).

Clinical trials of vaccines (all) registered on ClinicalTrials.Gov (5,100 as of 4/22/2015)

Clinical trials specifically related to the MMR vaccine (116 publications as of 4/22/2015).

Articles about vaccines that have been retracted (19 publications as of 4/22/2015).

Clinical trial publications (all, not just vaccines) that have been retracted (3 publications as of 4/22/2015, note that the Wakefield paper on autism and the MMR vaccine is not listed here because it was a retrospective observational study, not a clinical trial).

All retracted publications indexed in PubMed (3,820 publications as of 4/22/2015).


In Defense of Mark Cuban

Mark Cuban recently suggested that people should be doing quarterly blood tests, a proposal for which he has been roundly criticized and even ridiculed.  His specific proposal may be off base, but there is not universal consensus that increasing the frequency of medical testing is a bad thing.  E.g. From Eric Topol https://twitter.com/erictopol/status/584144448067674112
 
Much of the argument against increased testing frequency is prefaced by the assumption that a single abnormal result will trigger an expensive and morbid workup, but the reality is that if you are testing more frequently, you learn about fluctuations and variance.  Among physicians, the near universal response to a single abnormal test result is to repeat it.  If, as is usually the case, it comes back normal, you dismiss the abnormal result.  If it still comes back abnormal, you are much more confident that something is going on.
 
There are reasons to think that more frequent testing might be a good thing.  When on a diet many people check their weights daily. Do we really think our weight will change significantly in a day?  No, it is a quick inexpensive test.  Do people panic if their weight goes up or down a couple of pounds on any given day, no.  But the trend does provide useful feedback and motivation.  Back in the day of mechanical pedometers, activity tracking was strictly for geeks and not viewed as terribly useful. Now that smartphone and FitBits have made tracking convenient and widely accessible, we are realizing that activity tracking can be useful, perhaps especially so in managing chronic disease.
 
Transistors got so cheap because we make so many of them (8 trillion transistors a second!).  Medical tests remain expensive in part because we have locked in a low volume high cost mode of operation.  If we did daily cholesterol checks, the market would be there to support much lower cost higher volume solutions.  And yes, many people would learn that a donut in the morning really does play havoc with their blood lipids.
 
Medical testing is driven by  technology that is not all that different from what we use in computers. Opto-electronics, robotics, microchemistry, etc.  In the 1970s, a complete blood count (CBC) cost about $20 and a chem 20 panel was maybe $100.  If these tests had followed Moore’s law, falling in price by a factor of 2 every couple of years, they would now be so cheap that we would not even bother billing for them.  DNA sequencing has in fact blown Moore’s law away because it has gotten so cheap so fast.
 
Not saying Mark Cuban has proposed the magic bullet, but we need to explore the options that technology makes possible.

This Year’s “Lousy” Flu Vaccines Was Actually a Huge Success and Likely Saved Thousands of Lives

The CDC has downgraded its estimate for the effectiveness of this year’s influenza vaccine to 19%.  Historically, this is not great, and it is widely being reported as a failure.  Further, US influenza vaccine coverage rates are a disappointing 40% meaning that only about 4 in 10 people actually get vaccinated.  Too many people are taking the view, “Even if I get the flu vaccine, there is still an 80% chance I will get the flu so why should I bother?”  Is the situation really so bleak?  Actually, this year’s “lousy” flu vaccine was a huge success and it almost certainly saved thousands of lives.  To see why, read on.

Modeling influenza cases in vaccinated and unvaccinated populations.

Despite common perceptions, influenza is not all that contagious. The reproductive ratio (R0) is about 1.75 for influenza.  In other words, each case of influenza infects 1 or 2 or maybe three new people.  Compare that to a highly contagious disease like measles where each case typically infects 19 more individuals.  Influenza does have a short generation time; a new case becomes infectious only about 3.6 days after exposure.  Fortunately, the flu season is relatively short, may 1 to 2 months, but in that time, influenza may go through 15 generations.  One infected person infects on average 1.75 new people who in turn infect about 3 people who in turn infect about 5, and so on.

So what about at this year’s vaccine?  R0 is defined on people who never got the vaccine.  When we say the vaccine is 19% effective, we are saying if everyone got vaccinated it would reduce R0 by 19% [1] or to about 1.42.  Unfortunately, only about 40% of Americans did get the vaccine, so on average R0 was maybe 1.62.  Does not seem like a big deal, 1.75 vs 1.62, but look at what happens with exponential growth.  With the “lousy” vaccine, one infected person infects about 1.62 new people who in turn infect about 2.6 who in turn infect about 4.2.  It is like your financial advisor keeps saying, the miracle of compound growth.  Every generation, the difference between unvaccinated populations and vaccinated populations gets bigger and bigger.  And for flu, there are many generations.  After fifteen generations in an unvaccinated population, a single case of influenza will spread to about 10 million people if R0 is 1.75.  But if R0 is reduced just a bit to 1.62, it will spread to about 3.6 million people.  In other words, even this year’s “lousy” vaccine taken by only about 40% of the population still ended up reducing the total number of flu cases by 60%.

A 60% reduction in influenza cases is a big deal.   About 3,600 people die from influenza, even with vaccination.  If we did not have the vaccine, as many as 10,000 deaths would be expected.  So yes, when I say this year’s flu vaccine was a success, I mean YES, it was a big success that saved thousands of lives.  Don’t believe all the nay saying in the press, and get vaccinated.  It really does save lives.

Footnotes:

[1] A note about models  and effectiveness. For the purpose of this simple model, vaccine effectiveness is defined as the probability that a vaccinated individual will resist infection when they are exposed to the virus.  For a variety of practical and ethical reasons, we cannot do an experiment to measure vaccine effectiveness directly by, for example, conducting a randomized controlled trial.  When the CDC reports vaccine effectiveness, they rely on observational studies.  In the case of flu vaccine, the approach is to take all of the people coming to a medical facilities and ask two questions: 1) Do they actually have influenza or is their URI due to some other agent? 2) Did they get the flu vaccine this year?  To determine vaccine effectiveness, you compare the fraction of vaccinated people who really have influenza to the fraction of unvaccinated patients who have influenza.  If the vaccine did nothing, the ratio would be the same and we would say the effectiveness is zero.  If the vaccine were completely effective, none of the vaccinated people would test positive for influenza and we would say the vaccine was 100% effective. And if the fraction of vaccinated people who got the flu is lower, say 0.8 fold less than the fraction of unvaccinated people who really got the flu, we would say the vaccine was 20% effective.

There are some caveats to taking the effectiveness from observational studies  and using them in a mathematical model for an epidemic.  The very simple model used above assumes people are independent and contacts between people and occur randomly with uniform probability.  We know this is a simplistic a view of real societies.  For example, people tend to live in groups (families, roommates, etc.), and vaccination is likely to be strongly correlated within a group (if you got vaccinated, chances are high that your spouse and kids did as well).  Also, because people living in a group tend to spend a lot of time together, if one person in the group gets infected with the flu, there is a much higher than average likelihood that they will expose everyone in the group to the virus.  On the other hand, if everyone in the group was vaccinated, the group will be doubly protected, first because each member in the group is less likely to come down with the flu in the first place, and second because even if one person in the group does come down with the flu, they are less likely to pass it on to the whole group.  This means that the observationally measured effectiveness may be somewhat higher than the mathematical effectiveness.  Define susceptibility as 1-effectiveness.  In the most extreme case, the observationally measured susceptibility might be the square of the mathematical susceptibility so an observational 81% susceptibility (19% effectiveness) might correspond to a mathematical susceptibility of 0.9 and a mathematical vaccine effectiveness as low as 10%.  Note, however, that even in this worst case, vaccination reduces the number of case by more than 40% after 15 generations.

For the non-scientists who have made it this far, these calculations are what we call “back of the envelope” estimates.  The intent is to give a feel for what is going on, but not to achieve rigorous accuracy.  Far more sophisticated models for influenza epidemics have been developed by scientists who have devoted their careers to epidemic modeling.  See, for example, a study on the effects of commuting on influenza spread.

Consolidation, Oligopolies and Regulation in Healthcare

A recent column in The Incidental Economist raises a worrisome question.  If financial cuts to hospitals adversely affect patient outcomes, what about financial penalties imposed in the course of regulatory responses for failure to meet quality metrics?  Do we have a No Child Left Behind problem where defunding poorly performing schools only makes them worse?

Management of both for profit and nonprofit hospitals act as if they were for profit entities, and they should be expected to avoid the possibility of financial penalty.  If the imposition of penalties were rare, such a system would work.  Unfortunately, CMS is penalizing some 2610 hospitals in the latest round of quality assessments, including 143 out of 293 teaching hospitals in the US.  Are these hospitals now entering a slow but inevitable death spiral where cuts in reimbursement further erode care resulting in additional penalties and even worse care?

Traditionally, healthcare regulation has relied on the imposition of rare but draconian penalties.  Physicians or other health professionals who were sufficiently egregious would have their license revoked and their career in healthcare derailed.  The response for the vast majority of providers was to stay as far away as possible from the regulatory threshold.  The system worked well; most providers behaved professionally, and penalties rarely needed to be imposed.

Steve Brill, in his recent book America’s Bitter Pill, favors encouraging consolidation to build regional vertically integrated health systems. For example, let the Cleveland Clinic become the overwhelmingly dominant provider in its region.  While there will certainly be economies of scale and integration in such a scenario, such regional oligopoly/monopoly providers will be too big to shutdown and may be essentially unregulatable.  Regional healthcare oligopolies are huge economic players often generating a billion dollars are year in revenue. The Cleveland Clinic, for example, is the second largest employer in Ohio, has $11.9 billion in assets, generated $1.7 billion in unrestricted revenue for 2014 and made $130,089 in political contributions in 2012. In contrast, the budget for the Ohio State Medical Board was $8 million for 2011. The board is responsible for regulating all physicians, nurses and cosmetic therapist, acupuncturists and other health professionals statewide, and it is strictly forbidden from participating in politics. It does not seem realistic to expect that the Medical Board can effectively monitor the detailed operations of a large regional healthcare oligopoly, and an oligopoly can always seek legislative relief if regulations get in the way. In the worst case, regional healthcare oligopolies will be in a position to capture the regulatory process and possibly even subvert it into becoming a barrier to entry for competing providers.

Current health policy strongly favors consolidation of healthcare into large hospital based networks. For example, hospitals can bill Medicare for facility fees covering indirect costs while independent providers are not allowed to bill for these expenses. As a result, hospitals have been buying up independent physician practices and patients have been seeing dramatic increases in bills. If there are true economies of scale in healthcare, which is likely, then market forces should naturally result in consolidation and there is no need to subsidize this trend artificially at a cost of many billions of dollars in added fees. On the other hand, there are costs to consolidation. As discussed above, regional oligopolies may be difficult or impossible to regulate effectively. Monopolies also tend to suppress innovation and increase costs.

An alternative approach would be to enforce competitive markets in healthcare. Use fair trade powers to break up regional oligopolies while at the same time making cost and performance data more accessible so that consumers can make better informed decisions about their healthcare purchases. Regulation by state medical boards would likely be more effective as well.

The FAX and the case for regulating EMRs as common carrier utilities.

Primary care and community medicine remains totally dependent on the FAX machine.  Doctors orders are FAXed to providers and suppliers, various approval forms and lab work are FAXed back.  Referrral letters, test results, prescriptions, scheduling, you name it, it all goes by FAX. Reams and reams of FAX paper drive the life of primary care medicine and the associated network of pharmacies, suppliers and labs and facilities that together make up most of community medicine.

Why do we rely on an obsolete technology?  FAXes are slow, error prone, insecure and expensive.  An electronic prescription can be sent to the pharmacy during a patient visit.  A FAX order has to be printed out, picked up by someone in the office, they need to verify the correct FAX number, write out a face page, put them in the FAX machine, dial the number and wait for the FAX to go, hopefully on the first try.  At the other end, someone needs to sort through the pile of incoming FAXes, assign a patient ID to each of them, read the request and dispatch the paper accordingly.  Hopefully the machine did not jam or miss-feed on either end.  Hopefully, it got sent to the right number.  Hopefully two sheets of paper did not stick together and get miss-sorted.  Hopefully the discarded paper FAX will be appropriately shredded and disposed.  And if all goes well, the message is communicated.

Again, why do we rely on FAXes in health care?  The answer is simply that FAXes are the highest common denominator of information exchange between all of the various physicians, nurses, labs, suppliers and facilities involved in community medicine.  Yes, we have been making significant progress in electronic prescribing, but the sad reality is that most electronic medical records (EMRs) still cannot talk to each other.  We rely on FAXes because they are a common carrier standard.  You can go to any store, buy a FAX and be relatively confident that you will be able to send and receive messages from everyone else’s FAX machines.

With EMRs, there is no expectation, much less a guarantee of interoperability.  The fact that vertically integrated health systems can impose a standard organization wide gives them a huge advantage and is driving consolidation in health care.  It also creates problems every time a patient needs to change providers and strongly discourages patients from exploring their care options.  It also leads to huge duplication of effort because every time a patient does change providers, the best that we can hope for in most cases is that there past medical records will be printed out and stored as scanned documents in their new providers EMR.  Of course those scanned documents are slow to access, poorly legible and cannot be indexed or searched.

If EMRs were regulated as common carrier utilities, we could greatly enhance competition and transparency in healthcare markets.  Basically impose the same requirements that we impose for a FAX machine; if you are going to sell and EMR it needs to be able to communicate patient records reliably and without data loss to anyone else running a standard EMR.  Patients would then be in a much better position to maintain their own personal medical records (PMR) and to shop for services and providers that best meet their needs.  When patients change providers, the new provider would not have to rerun all of the recent test because they could access them from the previous provider.  Meaningful Use requirements are moving incrementally toward interoperability, but entrenched resistance is strong and progress has been very slow.

Half of all healthcare spending goes to 5% of the population: Why this is a good thing

A frequent critique that has been levied at the US healthcare system, half of all healthcare spending goes towards 5 percent of the population.  Stop for a moment and ask yourself, why is this a problem?  Sick people need more healthcare than well people, and many diseases are chronic.  Obviously, if you have been treated for diabetes, heart disease, cancer or neurological disease in the past, there is an increased risk that you will be treated for these disease in the future.  Many diseases increase in prevalence as we age so older people tend to consume a disproportionate share of healthcare resources.  The fact half of healthcare resources are targeted to a relatively small fraction of the population is actually a good thing.  It says that the majority of the population is healthy and does not need a lot of medical care.

If you really want to get upset about unequal distribution of resources, think about fire departments.  Virtually 100% of fire department spending is consumed on the 0.01% of buildings that are on fire.  If owner of buildings on fire had to make a high co-pay before sounding the alarm and fire departments needed prior authorization before responding, we could greatly reduce expenditure on fire departments.  Of course, that would mean fire departments weren’t serving their fundamental role which is the point.

GME Slot Allocation: Why We Have the Physician Distribution We Do

There has been a lot of discussion of graduate medical education (GME) funding in response to a recent IOM report.  Basically, under the current system Medicare wites a blank check to academic training centers based on the number of GME positions they have.  An issue not discussed is how institutions allocate GME slots between different training programs.  The way training positions are allocated determines the number of primary care physicians and the mix of specialists vs. subspecialists in the physician workforce.  Slot allocation is, therefore, a critical issue in healthcare policy.

Changes in GME Slot Allocation

The number of GME training positions has increased only 17% over the past two decades, but there have been significant changes in the allocation of GME slots between primary care and medical specialties and between specialties and subspecialties.  The allocation of GME training programs and residents are summarized in Table 1 (data from Brotherton and Etzel 2002,  Brotherton and Etzel 2008, and Brotherton and Etzel 2013)

Programs Residents
Year Specialty Sub- specialty Total Specialty Sub- specialty Total % Sub-specialty
1995 4356 3301 7657 86299 11736 98035 12.0%
1996 4351 3436 7787 86320 11756 98076 12.0%
1997 4368 3493 7861 86421 11722 98143 11.9%
1998 4331 3561 7892 85631 11752 97383 12.1%
1999 4268 3678 7946 85460 12529 97989 12.8%
2000 4228 3757 7985 85081 11725 96806 12.1%
 
2002 4176 3888 8064 85368 12890 98258 13.1%
2003 4169 4023 8192 86357 13607 99964 13.6%
2004 4151 4095 8246 86975 14316 101291 14.1%
2005 4149 4254 8403 88241 14865 103106 14.4%
2006 4134 4368 8502 89269 15610 104879 14.9%
2007 4119 4470 8589 89618 16394 106012 15.5%
2008 4100 4594 8694 90907 17269 108176 16.0%
2009 4128 4745 8873 91963 17877 109840 16.3%
2010 4131 4836 8967 93153 18433 111586 16.5%
2011 4152 4959 9111 94486 18941 113427 16.7%
2012 4207 5180 9387 94990 20121 115111 17.5%
1995 to 2012 -3% 57% 23% 10% 71% 17%


The number of specialty programs has decreased form 1995 to 2012, but the number of subspecialty programs has increased by 57%.  The total number of residents has increased 17% over this time period with a 10% growth in the number of specialty residents and a 57% increase in the number of subspecialty residents.  As a percentage of the total, the fraction of GME slots devoted to subspecialty training has increased from 12.0% in 1995 to 17.5% in 2013.  Similar results are reported by Wynn et al

Looking more closely at recent data, in specialty training programs, from 2008 to 2012 the total number of positions increased by 6.4% while the fraction of slots devoted to primary care specialties has increased by 3.5%.  Despite repeated calls for increasing the number of primary care physicians over the past several decades, the fraction of GME training slots devoted to training primary care physicians has actually fallen from 36.6% in 2008 to 35.6% in 2012.

2008 2012 Change
Family med 9353 9934 6.2%
Internal med 22132 22710 2.6%
Pediatrics 8089 8332 3.0%
Total primary care 39574 40976 3.5%
% primary care 36.6% 35.6%
Pathology 2312 2282 -1.3%
Radiology 4455 4438 -0.4%
Surgery general 7712 7828 1.5%
Orthopedic surgery 3303 3501 6.0%
OB/Gyn 4815 4931 2.4%
Anesthesiology 5208 5507 5.7%
Emergency medicine 4750 5458 14.9%
Cardiology 2589 2718 5.0%
Interventional cardiology 240 300 25.0%
Hematology/ Oncology 1393 1531 9.9%
GI 1292 1407 8.9%
Dermatology 1069 1191 11.4%
Opthalmology 1220 1343 10.1%
Total 108176 115111 6.4%

Large increases are seen in some subspecialties including emergency medicine, interventional cardiology, dermatology and ophthalmology.  Non direct patient care specialties including pathology and radiology have seen an absolute decrease in resident positions and most surgical specialties have not kept pace with the overall growth in the number of residency positions.

The Resident Cap

The Balanced Budget Act of 1997 (BBA) fixed the number of medical residents that would be funded by Medicare indirect medical education (IME) and direct graduate medical education (DGME) reimbursement at the number for each hospital in 1996. The cap was modified in 1997 to exclude consideration of podiatry and dental residents, and in 1999 the  Balanced Budget Refinement Act (BBRA) increased the limit for rural teaching hospitals to equal 130% of each rural teaching hospital’s 1996 resident count (source AAMC).

From 2002 to 2012, there has been a gradual increase in the total number of GME training positions.  This may be the result of funding from sources other than Medicare, or institutions funding additional slots with internal resources.  It also reflects a shift toward fellowship training which is partially supported by the institution and partially funded by Medicare or Medicaid.

Direct Financial Impact of GME Programs

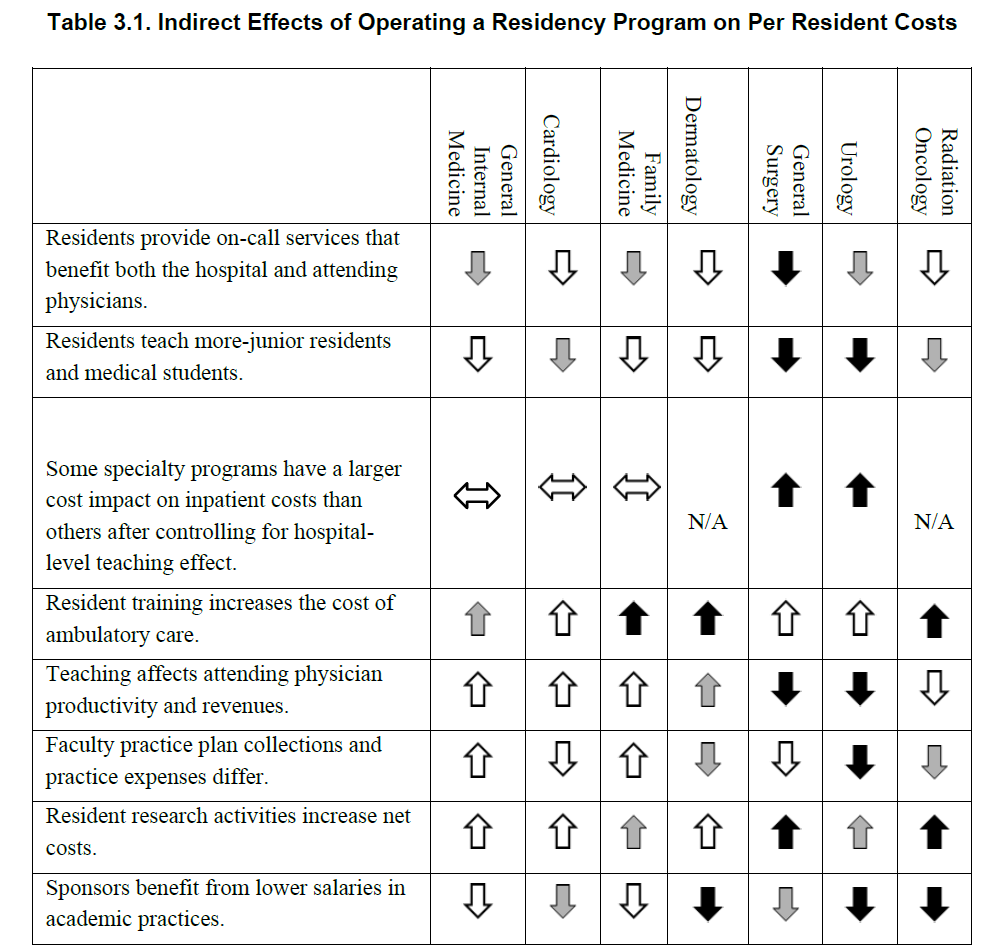
The financial impact of GME programs  has been examined recently (Wynn et al., 2013).  Table 3-1 from their work is reproduced below.

Direct financial costs/savings may be part of the reason primary care training positions have not kept pace with overall growth in training positions.  Primary care training programs are a burden on faculty time in outpatient clinics and residents do relatively little to save the institution money.  On the other hand, these direct costs do not explain the lack of growth in surgical programs and predict that dermatology would shrink rather than showing the dramatic expansion that has been observed.

Capture

Indirect Financial Impact of GME Programs

It is difficult to study individual programs or medical specialties in isolation.  For example, hospital and specialty clinics generated $7.23 of charges for every $1 of charges in primary care (Saultz et al., 2001).  The rapid growth in emergency medicine programs may reflect these indirect financial impacts.  Emergency rooms (ER) are literally the gateway to most hospitals with many centers moving to a model where all admissions are processed through the ER.  ERs not only generate significant revenue themselves, they are also key drivers of revenue across the institution.

Marketing and Advertising

As noted by Wynn et al, having GME training programs enhances an institution’s reputation, and essentially all of the top ranked hospitals nationally have GME training programs in a wide range of specialties and subspecialties.  Priorities in marketing may explain some of the changes that have occurred in GME slot allocation.

Reward for Faculty/Departmental Contributions to the Institution

In an academic center, training slots are an important currency for faculty recruiting and retention.  Faculty are motivated by their desire to be involved in training and in many cases forgo significant personal income as a result of their decision to pursue an academic career.  It follows that the size of a training program is a key consideration for faculty in choosing between institutions.  Further, both department size and training program size correlate strongly with national rankings across a wide range of academic disciplines.  A reasonable hypothesis is that hospital administration award training grant slots in part to reward faculty and departments that are benefitting the institution.

Admissions

In the past, the number of available GME training slots exceeded the number of US medical graduates and many GME slots, particularly in primary care specialties, went unfilled.  With the growth in MD, DO and offshore medical degree programs, the number of medical graduates now significantly exceeds the number of available GME training slots and essentially all positions are filled.   Programs may once have been unwilling to expand primary care training programs because they could not fill their existing programs.  High applicant demand may still motivate expansion of some training programs, but lack of demand is no longer a major issue.

Conclusions

The need for an increase in the number of primary care physicians has been widely discussed for several decades.  Despite widespread agreement that healthcare would benefit from increased numbers of primary care physicians, the absolute number of GME training slots devoted to primary care specialties has not kept pace with the increase in total number GME training positions.  The proportion of positions dedicated to training subspecialists has increased with notable growth in interventional cardiology, emergency medicine, dermatology and ophthalmology.  The subspecialties that have increased disproportionately are all hospital based or make extensive use of hospital resources and all generate substantial financial returns for hospitals.

While non-patient contact specialties like radiology and pathology are hospital intensive, these services do not generate demand.  Rather they provide services requested by other physicians.  With improvements in imaging and analytic technology, the productivity of physicians in these non-patient contact specialties has likely improved meaning that hospitals do not need to expand these programs to meet demand.

The changes in GME slot allocation appear to reflect the needs of hospitals rather than the needs of the broader community.  Shifting the distribution of training slots to better address the needs of the community and Medicare/Medicaid system could improve the overall efficiency and effectiveness of the healthcare system.

Brotherton, S. E., and Etzel, S. I., “Graduate Medical Education, 2011–2012,” Journal of the American Medical Association, Vol. 308, No. 21, pp. 2264–2279.

Brotherton, S. E., and Etzel, S. I., “Graduate Medical Education, 2008–2009,” Journal of the American Medical Association, Vol. 306, No. 9, 2009, pp. 1015–1030.

Brotherton, S. E., Simon, F. A. and Etzel, S. I., “Graduate Medical Education, 2000–2001,”Journal of the American Medical Association, Vol. 286, No. 9, 2001, pp. 1056–1060.

Saultz, J. W., McCarty, G., Cox, B., Labby, D., Williams, R., and Fields, S. A., “Indirect Institutional Revenue Generated from an Academic Primary Care Clinical Network,” Family Medicine, Vol. 33, No. 9, 2001, pp. 668–671.

Wynn, B. O., R. Smalley, and K. Cordasco. 2013. Does it cost more to train residents or to replace them? A look at the costs and benefits of operating graduate medical education programs. Santa Monica, CA: RAND Corporation. http://www.rand.org/pubs/research_reports/RR324 (accessed October 14).